
How Long Do P&C Core System Implementations Really Take?

To address this question, we reviewed hundreds of press releases from over three dozen vendors and 600+ US and Canadian P&C insurance customers.
We’ve mapped our findings by tier, duration, and deployment characteristics in a downloadable PDF below.
Use this analysis to understand norms and help validate your initial estimates.
As you consider a core system implementation, a key question will be “How long is this going to take?”
Establishing realistic timeframes early is critical for obvious reasons, such as securing go/no-go decisions, ensuring key deadlines are met, and avoiding budget overruns. It’s also critical to avoid setting wrong expectations that can distort perceptions and make even a successful project seem like a failure.
I recall a conversation with an executive sponsor about this challenge with expectations. His project team had pulled off one of the smoothest implementations he had seen in his career – going live in just under a year. However, some of his executive peers had no experience with core system implementations and did not appreciate the level of effort involved. They thought of the core system implementation as a routine IT project – like rolling out hardware or software updates – work they believed should take a few months at most. Unfortunately, these unrealistic expectations were not addressed. To this sponsor’s dismay, even after the successful go-live, he dealt with a lingering sense of disappointment among his peers about the “late” project.
Answering the question of “how long?” is critical, but it can be difficult to find information that reflects more than general estimates, survey responses, or anecdotes. Timeframes can be very broad. At one extreme, you’re likely to hear about incredibly short implementations from vendor sales reps touting (understandably) their most noteworthy successes. At the other extreme, your industry peers are more likely to share their challenges with extended timeframes – especially if they are deep in a complex, large-scale implementation.
Here’s a data source to consider that tempers these extremes: press releases about core system implementations. As published documents, these provide more comprehensive and objective information than single-source assertions or anecdotes. In nearly all cases both the vendor and insurer have formally reviewed and agreed to make public the content of the press release. With published dates for selection and subsequent published dates for go-lives, these can serve as a quasi-audit trail for implementations.
In April 2022 we reviewed 980 press releases from P&C core system vendors active in the US and Canada. Within these we identified 61 core system implementations with P&C insurance carriers that had gone live over the past decade with published go-live dates preceded by published selection dates. (For more details, see our note on methodology at the end of this article.). These provide two specific points in time at which both the vendor and insurer agreed to publicly share when they were starting their implementation, and then when the insurer had begun successfully using the system in production.
These announcements aligned with industry trends:
There has been a significant rise in the percentage of companies deploying suites or all-in-one platforms from the same vendor.
Cloud deployments have increased in frequency to nearly 90% of go-lives in 2021. (Over two dozen companies also announced cloud migrations from earlier on-premises implementations.)
There is a strong correlation between the direct written premium (DWP) or tier of an insurer and duration from selection to go live.
The average duration from selection to go live for these 61 implementations was 25 months. The shortest duration was 12 weeks – an all-in-one platform deployed in the cloud for an insurer with $10M DWP. The longest duration was 5 years and three and a half months – an on-premises suite implementation for an insurer with $1.3B DWP.
When grouped by size, the average durations were as follows:
$100M DWP and lower: 17 months
$101M to $500M DWP: 22 months
$501M to $1B DWP: 29 months
Over $1B DWP: 35 months
Cloud-based deployments began to increase dramatically in 2018. Use of cloud was associated with shorter durations and smaller insurers. Average duration for all cloud-based deployments was 17 months vs. 29 for all on-premises deployments. Average DWP for cloud-based deployments was $230M vs. $1.4B for on-premises.
Cloud deployments also had shorter average durations than on-premises when comparing insurers of similar size. For example:
Among a group of insurers from $40M to $50M DWP, cloud deployments averaged 19 months duration vs. 24 for on-premises.
Among a group from $200M to $300M DWP, cloud deployments averaged 15 months duration vs. 23 months for on-premises.
Among insurers from $500M to $600M DWP cloud deployments averaged 21 months duration vs. 30 for on-premises.
We’ve mapped our findings by tier, duration, DWP, core system modules, and deployment type in the chart below. (See Figure 1. US and Canadian Core System Implementations, 2012 through 2021).
For the vertical axis, we’ve plotted each implementation by DWP within the following tiers, with average durations also shown for each tier:
Tier 1: $5B to $25B DWP
Tier 2: $1B to $5 DWP
Tier 3: $501M to $1B DWP
Tier 4: $101M to $500M DWP
Tier 5: $26M to $100M DWP
Tier 6: Up to $25M DWP
For the horizontal axis, we’ve plotted each implementation by duration in six-month increments. Average DWP for each duration period is also shown.
At the intersection of DWP Tier and Duration, we’ve displayed the DWP of the insurer along with icons representing the core system modules that were implemented. On-premises implementations are represented by building icons for policy, billing, and claims modules. An implementation with three building icons represents a suite with all three policy, billing, and claims modules. A single building icon represents a single module – a policy module in the first position, billing in the second position, and claims in the third and last position. A single, larger building icon represents the implementation of an on-premises, all–in-one platform.
We’ve displayed cloud implementations in a similar manner with cloud icons. Smaller cloud icons are shown in sequence for policy, billing, and claims modules. A single, larger cloud icon represents a cloud all-in-one platform.
Figure 1. US and Canadian Core System Implementations, 2012 through 2021
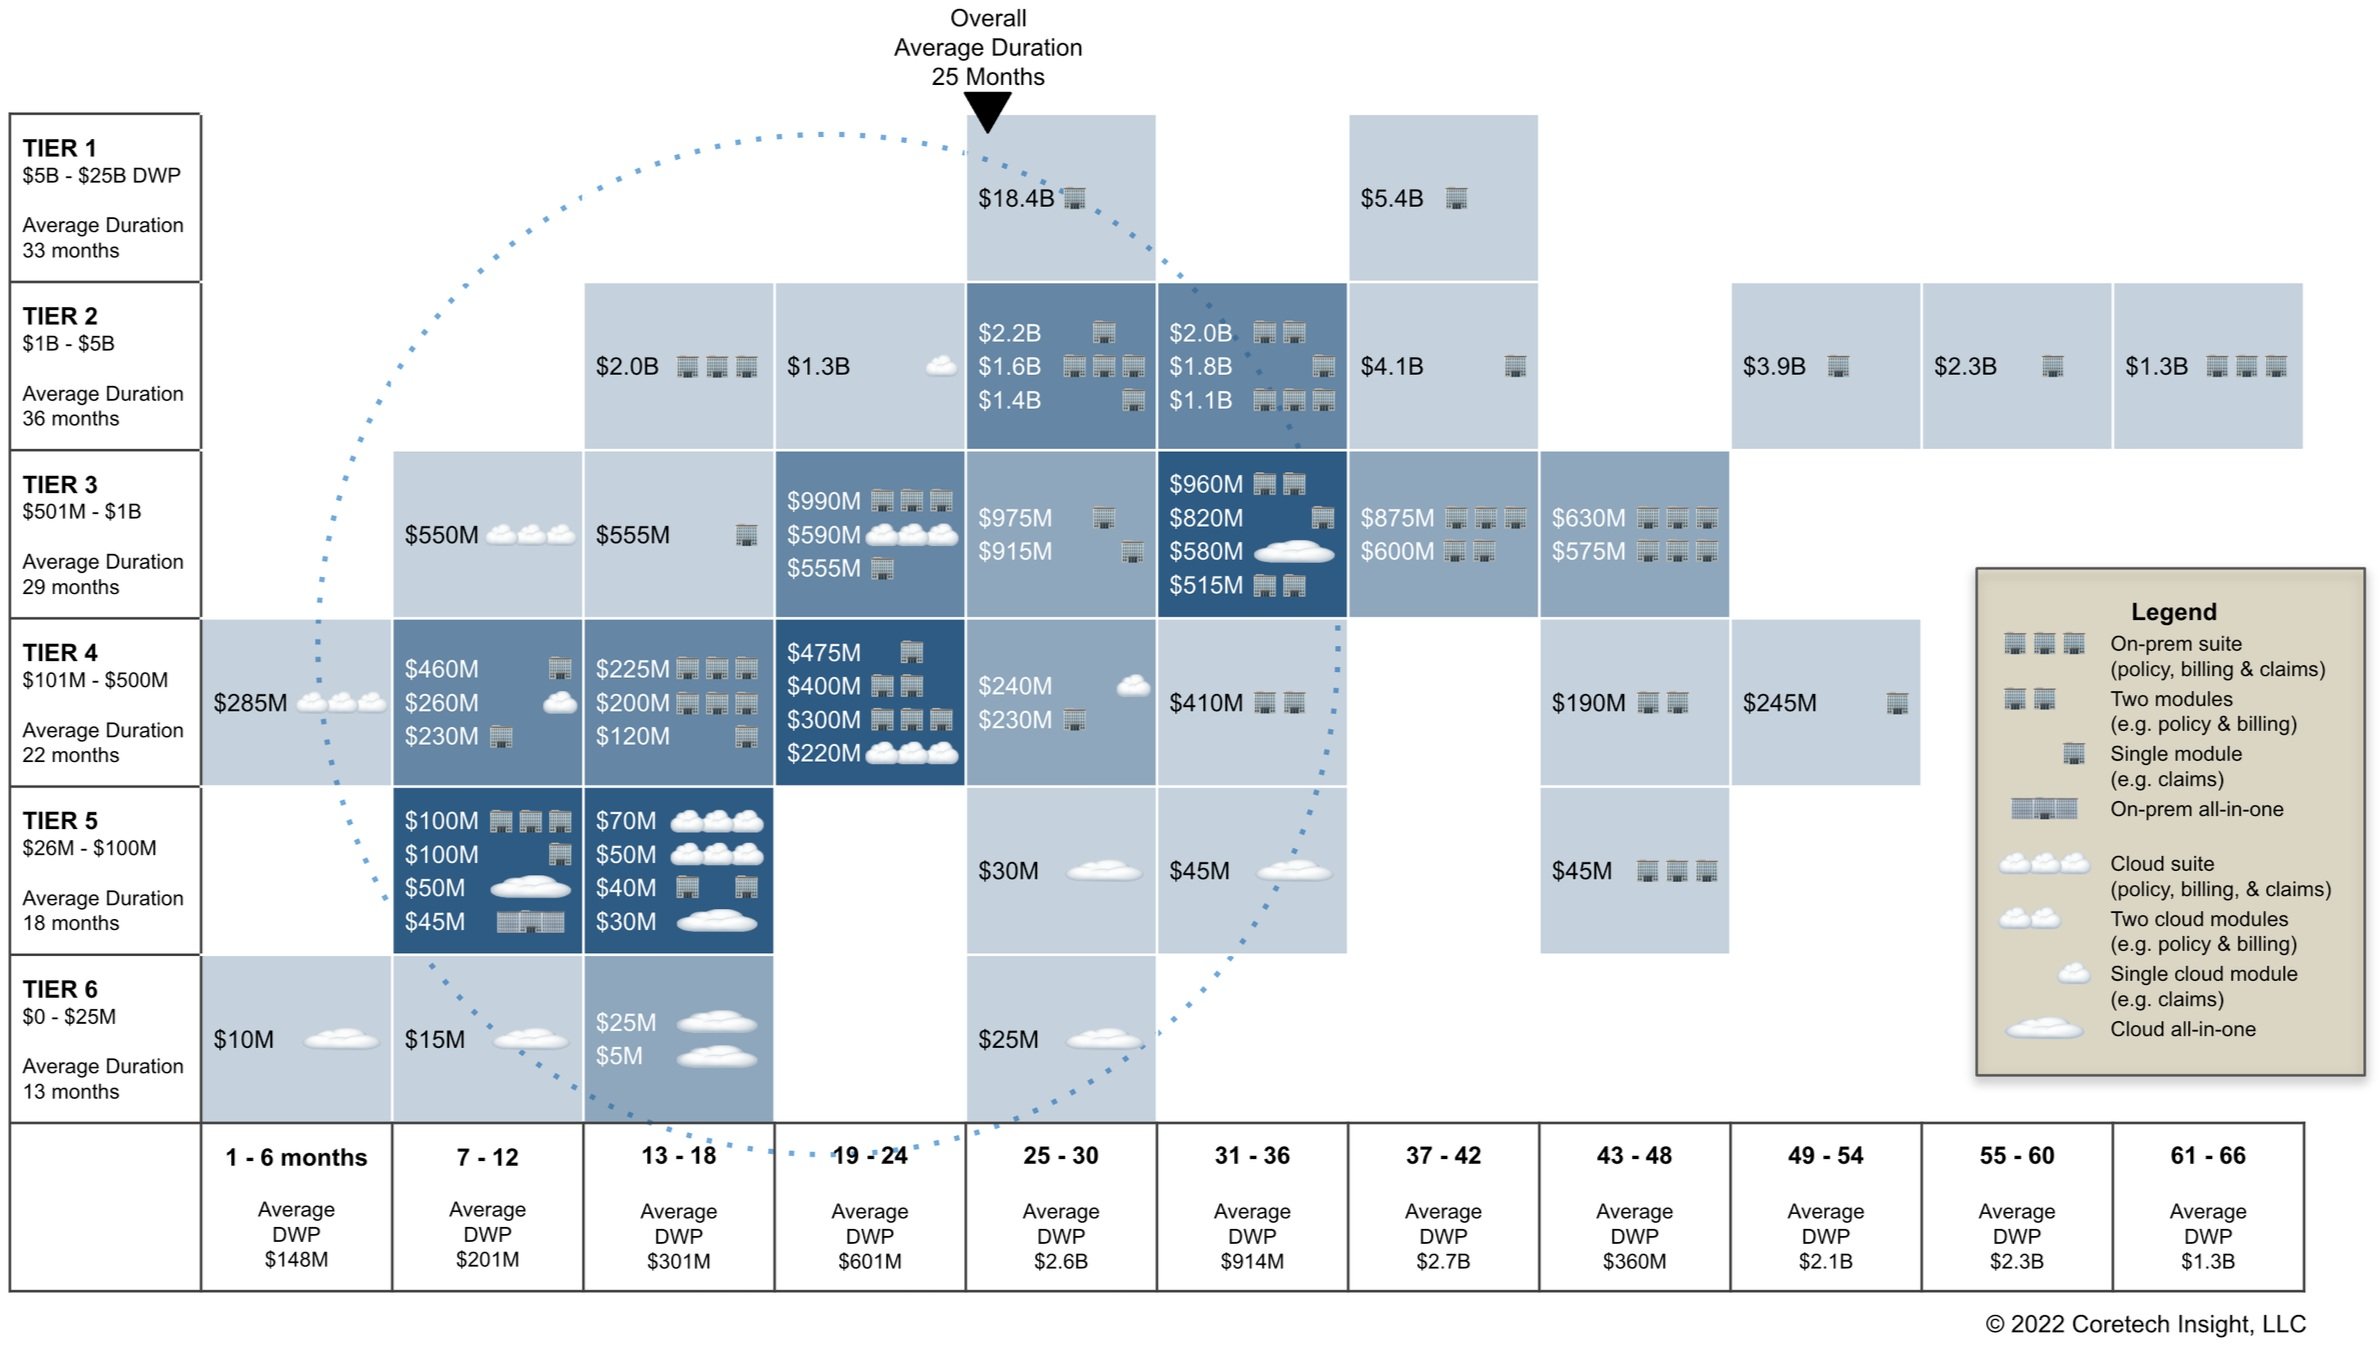
Source: Coretech Insight, May 2022
(Click here for a downloadable PDF of Figure 1.)
Use this map to assess norms for other P&C insurers similar to your organization and incorporate their actual results into your planning.
For example, imagine you’re with a $200M DWP (Tier 4) P&C mutual insurer that’s considering a move to a new, cloud-based core platform. Figure 1 shows that a go-live within six months after selection has been achieved by one Tier 4 company. However, you can also see the average duration for Tier 4 is much longer: 22 months. Most of your $200M DWP peers are showing up between 7 to 18 months. Using these results, you might begin initial planning with a target range of 12 to 18 months from selection to go-live, with an understanding (based on the 22 month average for Tier 4) that a delay of a few months is possible.
Final point: “Go-live” does not mean “we’re all done.” In each press release these insurers presented their go-lives as the latest milestone in their ongoing efforts to transform and improve their companies. Half of these press releases cited specific follow-on plans, such as deploying additional platform modules, building out new insurance products, entering new territories, improving the digital experience, and enhancing data and analytics capabilities. Keep this in mind for your planning and expectation management. It’s not really a question of “how long ‘til we’re done?” but of “how long to achieve this key milestone and move to our next opportunity?”
A Note on Methodology
In April 2022 we reviewed 980 P&C insurer customer press releases (PRs) for P&C core system vendors active in the US and Canada (see our Solutions Directory). These were published on vendor websites and in various wire services and news sites such as Business Wire, GlobeNewswire, PR Newswire, Insurance Innovation Reporter, and PropertyCasualty360.
Our objective was to use these PRs to determine published timeframes for core system implementations for US and Canadian P&C insurance carriers. From this initial set of PRs we excluded those covering:
Implementations outside of the US or Canada
Customers that were not insurance carriers (such as MGAs, self-insureds, and TPAs)
Implementations that did not include at least one core policy, billing, or claims module (such as portal-only or data/analytics-only implementations)
Implementations prior to 2012 or after 2021*
After these exclusions, 504 PRs remained spanning a full decade, from 2012 to 2021, that we grouped into the following categories:
Selection - 291
Go-Live - 149
Expansion, enhancement, or upgrade - 30
Cloud migration - 34
The majority of the 291 PRs announcing system selection were not followed by a PR announcing the selected system had gone live. Similarly, although many referenced implementation timeframes, the majority of the 149 PRs announcing a customer had gone live with a system were not preceded by a selection PR.
We were able to identify 61 selection PRs that were followed by go-live PRs. We focused our analysis on these pairs as they offer verifiable dates for when both vendor and customer agreed to publicly announce selection, and when they subsequently agreed the system had been successfully deployed into production.
* There were two exceptions - we included one press release published 15 December 2011, and one press release published 13 January 2022.
Customer history is a key indicator of a vendor’s future success
In preparing these findings, we reviewed 980 press releases and 273 public mentions of customers in various channels and venues such as vendor and customer websites, industry conferences, and social media.
This review enabled us to map relationships among 39 vendors active in the US and Canada and 624 P&C insurance customers.
Wondering about customer relationships (and results) for your vendor candidates?
Click the button below to reach out via email, or call us at +1 (908) 391-0950.
We’re ready to listen, compare notes, and work together to identify vendors with the customer relationships and experience most relevant to you.